Quick Answer
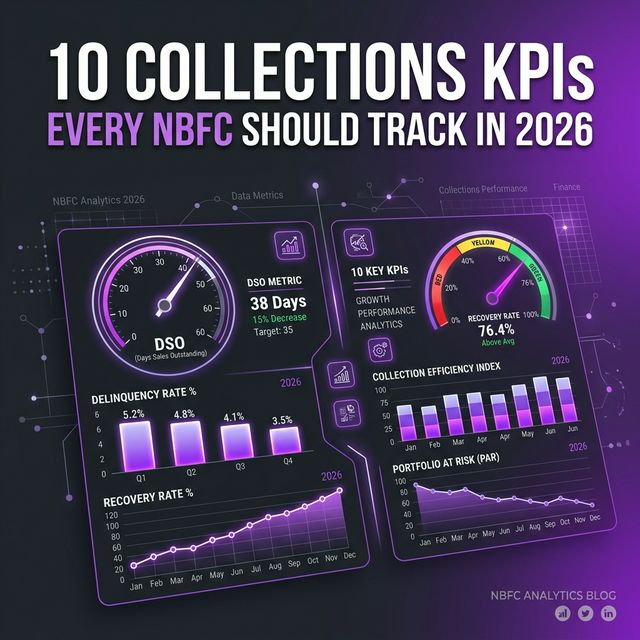
The 10 collections KPIs every NBFC must track: (1) DSO, (2) Right Party Contact rate, (3) Promise-to-Pay conversion, (4) Roll rate, (5) Cure rate, (6) Cost per rupee collected, (7) NPA formation rate, (8) Recovery rate by DPD bucket, (9) First-contact resolution rate, (10) Compliance score. AI-powered collections platforms typically improve KPIs 2-3 across the board within 90 days of deployment.
Most NBFCs measure collections performance the wrong way. They look at NPA ratio and total recovery amount — two metrics that tell you what already happened, not what is about to happen. By the time these numbers deteriorate, the damage is done: accounts have rolled deep into delinquency, recoveries are expensive, and borrower relationships are strained.
The shift happening in 2026 is from lagging indicators to leading indicators. Leading KPIs like roll rate, right party contact rate, and promise-to-pay conversion tell you — 30 to 60 days in advance — whether your collections engine is healthy or deteriorating. Lenders who track these metrics intervene earlier, spend less on recovery, and lose fewer borrowers permanently. If your collections operation does not have a live dashboard covering all 10 KPIs in this guide, you are running blind. The good news: modern collections management software India makes real-time KPI tracking operationally straightforward — and AI-driven platforms do not just track these metrics, they automatically improve them.
Collections Efficiency in India: 2026 Benchmarks
- 45–55% — Average Right Party Contact rate for human telecaller teams
- 20–35% — Typical Promise-to-Pay conversion on first contact for manual teams
- ₹0.08–0.15 — Cost per rupee recovered using human-led collections
- 70–80% — RPC rate achievable with AI-powered calling
- 60–70% — Cost reduction when AI calling replaces human telecallers
- 15–25% — Roll rate from SMA-0 to SMA-1 at median-performing NBFCs
The 10 Collections KPIs Every NBFC Must Track
These 10 KPIs span the full collections lifecycle — from pre-delinquency risk signals to compliance. Some are operational (how efficiently your team works), some are financial (how much you recover and at what cost), and some are predictive (where your portfolio is headed). Together, they form a complete collections scorecard that gives leadership an accurate, real-time picture of collections health.
Days Sales Outstanding (DSO)
Definition: DSO measures the average number of days it takes your NBFC to collect payment after a loan EMI or invoice becomes due. A rising DSO signals that borrowers are taking longer to pay — often the first visible sign of a collections problem before accounts formally enter delinquency buckets.
India Benchmark: 45–90 days depending on product type. Unsecured personal loans and microfinance typically run 45–60 days; MSME loans and commercial finance can run 60–90 days due to working capital cycles. Any NBFC above 90 days on a product category should investigate immediately.
How AI Improves It: Automated pre-due date reminders — delivered via AI voice call, WhatsApp, and SMS — significantly cut the days to first payment response. NBFCs deploying AI reminder sequences see 30–40% reduction in DSO within the first quarter because borrowers who would otherwise forget are nudged to pay before or on due date, preventing the 7–14 day drift that compounds across the portfolio.
Formula: (Total Receivables Outstanding ÷ Total Credit Sales) × Number of Days in Period
Right Party Contact (RPC) Rate
Definition: RPC rate is the percentage of collection call attempts that successfully reach the actual borrower — not voicemail, not a family member, not a wrong number, and not a disconnected line. This is arguably the most operationally critical KPI because every downstream metric (PTP conversion, cure rate, FCR rate) depends on first making contact with the right person.
India Benchmark: Human telecaller teams in India typically achieve 45–55% RPC rates due to peak-hour congestion, borrower avoidance behavior, and outdated contact information. Best-in-class human teams with dialer optimization reach 60–65%. AI-powered calling systems consistently achieve 70–80% RPC by calling at optimal times and using multiple numbers.
How AI Improves It: AI systems analyze historical call-answer patterns per borrower and call at the times each individual is most likely to pick up — typically 8–10am and 5–7pm for salaried borrowers, and midday for self-employed. Multilingual AI agents reduce wrong-number escalations and confusion that leads to disconnections. The result is a 60–70% improvement in RPC rate over average human teams, which flows directly into every other KPI in this list.
Formula: (Successful borrower contacts ÷ Total contact attempts) × 100
Promise-to-Pay (PTP) Conversion Rate
Definition: PTP conversion rate measures the percentage of successful borrower contacts that result in a promise to pay — and ideally, an actual payment fulfillment within the committed window. PTP rate is a direct measure of how persuasive and effective your collections communication is, and how well your channel mix supports payment completion at the moment of commitment.
India Benchmark: Manual telecaller teams see 20–35% PTP on first contact. High-performing teams using scripting and local-language agents reach 35–45%. AI personalization pushes this to 40–55% because the agent adapts tone, language, and payment options to each borrower's profile in real time.
How AI Improves It: AI collections agents deliver personalized messaging based on borrower history, outstanding amount, and payment behavior patterns. Critically, AI agents can send a payment link — UPI deeplink, net banking shortcut — within the same call interaction, removing the friction between promise and payment. Borrowers who would otherwise intend to pay but forget or face a multi-step payment process complete payment at higher rates when the link arrives mid-conversation.
Formula: (Promises to pay given ÷ Total contacts made) × 100
Roll Rate
Definition: Roll rate measures the percentage of accounts in one delinquency bucket that worsen and move into the next delinquency bucket during a given period. A high roll rate from SMA-0 to SMA-1 means your early-stage collections interventions are failing. Roll rates from SMA-2 to NPA signal structural credit or collections problems that will hit your provisioning hard.
India Benchmark: A 15–25% roll rate from SMA-0 to SMA-1 is concerning and common at median NBFCs. Best-in-class NBFCs maintain roll rates below 10% from SMA-0 to SMA-1 through early, automated intervention. Roll rates above 30% at any stage indicate a systemic collections gap that requires immediate attention.
How AI Improves It: AI-powered early intervention at SMA-0 — automated calls, WhatsApp messages, and SMS the moment an account misses payment — dramatically reduces forward roll. Human teams often reach SMA-0 accounts 5–10 days after the missed payment. AI systems reach them within hours. This early contact, combined with easy payment options, prevents the behavioral drift that turns one missed payment into a pattern.
Formula: (Accounts rolling to next delinquency bucket ÷ Total accounts in current bucket at start of period) × 100
Cure Rate
Definition: Cure rate is the percentage of delinquent accounts that return to current (standard) status within a given period — meaning the borrower has cleared all arrears and is back on track. Cure rate is the most direct measure of collections effectiveness: it tells you what percentage of your problem accounts you are actually fixing, not just contacting.
India Benchmark: Cure rates vary significantly by delinquency stage. At SMA-0, a 40–60% cure rate within 30 days is achievable with proactive collections. At SMA-1, cure rates drop to 25–40%. At SMA-2, curing to standard status is difficult — 15–25% is typical. By NPA stage, cure is rare and expensive, typically requiring restructuring.
How AI Improves It: The single biggest driver of cure rate is speed of intervention. Human teams, managing hundreds of accounts per agent, often take 5–14 days to make initial contact with a newly delinquent borrower. AI systems make contact the same day — or the same hour for high-risk segments. This matters enormously because the probability of curing an account decreases sharply with each day of delinquency. AI's ability to simultaneously contact all SMA-0 accounts without capacity constraints makes the speed advantage structural rather than situational.
Formula: (Delinquent accounts returned to current status ÷ Total delinquent accounts at start of period) × 100
Cost Per Rupee Collected
Definition: This financial efficiency KPI measures how much your NBFC spends in collections operations for every rupee it recovers. It captures total collections cost — agent salaries, dialer infrastructure, SMS/WhatsApp costs, supervisory overhead, and legal/field costs — against total amount recovered. A deteriorating cost-per-rupee-collected metric signals operational inefficiency even if absolute recovery amounts look stable.
India Benchmark: Human-led collections operations in India typically run ₹0.08–0.15 per ₹1 recovered, depending on portfolio mix and delinquency stage. For difficult portfolios (DPD 90+), human costs can exceed ₹0.20 per rupee recovered. AI-assisted operations reduce this to ₹0.03–0.06 per rupee recovered, with savings compounding as AI handles a larger share of the contact volume.
How AI Improves It: AI voice agents can handle 10–20x the call volume of a single human agent at a fraction of the cost. A team of 10 telecallers making 150 calls/day each (1,500 calls/day) can be augmented or replaced by AI that makes 50,000+ calls/day. The cost reduction is 60–70% on the human-replaceable portion of collections, with human agents retained for complex negotiations and high-value accounts. This is the most quantifiable ROI driver for AI collections adoption.
Formula: Total collections operating cost ÷ Total amount recovered in the same period
NPA Formation Rate
Definition: NPA formation rate tracks the rate at which performing accounts in your standard portfolio are slipping into NPA status. Unlike the NPA ratio (a stock measure), NPA formation rate is a flow measure — it tells you how fast the problem is growing right now. A rising NPA formation rate is a six-to-twelve-month early warning that your NPA ratio is about to deteriorate sharply.
India Benchmark: For most retail and MSME NBFCs, a quarterly NPA formation rate below 2% of the standard portfolio is considered healthy. Rates of 2–4% indicate emerging stress. Above 4% signals a systemic problem requiring underwriting review, collections escalation, and possibly RBI engagement. Seasonal spikes (post-harvest cycles for agricultural lenders, post-festival for consumer lenders) are normal and should be tracked separately.
How AI Improves It: NPA formation rate is primarily prevented, not treated. AI Early Warning Systems identify accounts showing pre-stress signals — declining transaction activity, irregular payment patterns, changes in GST filing behavior — and trigger automated pre-collections interventions weeks before those accounts become SMA. Combined with AI-driven automated dunning at SMA-0, NBFCs using this approach reduce NPA formation rates by 40–60%. For a detailed breakdown of how early warning systems work, see our guide on AI early warning system for NPA prevention.
Formula: (New NPAs created in period ÷ Total standard portfolio at start of period) × 100
Recovery Rate by DPD Bucket
Definition: This KPI measures the percentage of outstanding delinquent amounts that are actually recovered, segmented by Days Past Due (DPD) bucket. Segmenting by bucket is essential because recovery rates decline steeply as accounts age — and the resource allocation required to achieve each rupee of recovery increases dramatically. Tracking recovery rate per DPD bucket exposes where your collections strategy is working and where it is failing.
India Benchmark: Recovery rates by DPD bucket for Indian NBFCs: DPD 1–30: 75–85% (accounts are fresh; most borrowers will pay with a prompt); DPD 31–60: 50–65% (behavioral delinquency setting in; requires active outreach); DPD 61–90: 30–45% (serious delinquency; high agent effort required); DPD 90+: 15–30% (NPA territory; recovery requires restructuring, legal, or settlement).
How AI Improves It: AI-driven channel optimization — deploying the right channel (voice, WhatsApp, SMS, email) with the right message frequency at the right DPD stage — significantly improves recovery rates across all buckets. For DPD 1–30, pre-due automated reminders prevent entry into delinquency. For DPD 31–60, high-frequency AI calling with empathetic scripting and payment facilitation moves recoveries significantly. The math here underscores a strategic imperative: recovering ₹1 at DPD 1–30 costs dramatically less than recovering ₹1 at DPD 90+. Every rupee of investment in early-stage AI collections prevents 3–5x the recovery cost at late stage.
Formula: (Amount recovered from bucket ÷ Total outstanding amount in bucket at start of period) × 100, calculated separately per DPD bucket
First-Contact Resolution (FCR) Rate
Definition: First-Contact Resolution rate measures the percentage of collection interactions that result in a committed payment or full payment without requiring a follow-up contact. High FCR means your collections engine resolves cases efficiently — one interaction per case. Low FCR means you are burning call capacity on repeat contacts for the same accounts, increasing cost and reducing capacity for new delinquencies.
India Benchmark: Human telecaller teams in India typically achieve 25–40% FCR. The gap between promise and payment is the main reason FCR is low: a borrower promises to pay but cannot complete payment immediately because the process involves navigating to a payment portal, finding the account number, etc. AI-assisted teams achieve 40–55% FCR because the payment link is delivered within the same interaction.
How AI Improves It: AI collections agents dramatically improve FCR through three mechanisms: (1) in-call payment link delivery via SMS or WhatsApp while the borrower is still on the phone; (2) UPI deeplink that pre-fills the payment amount and account details, reducing payment friction to a single tap; (3) real-time PTP recording with automated follow-up triggers if payment is not completed within the committed window. This converts "I'll pay later" into "I'm paying now" for a significantly larger portion of contacts.
Formula: (Collection cases resolved on first contact ÷ Total cases handled in period) × 100
Compliance Score
Definition: Compliance score measures the percentage of collection interactions that are fully compliant with the RBI Fair Practices Code, TRAI calling regulations, and internal policies — covering prohibited language, calling hours, data privacy, and record-keeping requirements. Non-compliance is not just a regulatory risk; it is a borrower relationship risk and a brand risk that can trigger RBI scrutiny and penalty.
India Benchmark: RBI guidelines require 95%+ compliance as a minimum operational standard. Anything below 90% represents serious regulatory exposure. In practice, human-led teams often struggle to maintain 95%+ compliance because individual agent behavior is difficult to monitor at scale — a single agent making an off-hours call or using prohibited language can create outsized regulatory risk.
How AI Improves It: AI agents are deterministically compliant. They never make calls outside permitted hours (8am–7pm), never use prohibited or threatening language, automatically follow all required disclosures, and maintain a complete, searchable record of every interaction. Compliance score for AI-led collections is structurally 100% on rule-based parameters — not because of monitoring, but because the system cannot violate those rules. Human agents remain essential for complex negotiations, but the compliance risk is concentrated in a much smaller, more monitorable population of interactions.
Formula: (Collection interactions fully compliant with all applicable guidelines ÷ Total interactions in period) × 100
Building a Collections KPI Dashboard
Having the right KPIs defined is only half the job. The second half is building a dashboard structure that makes these KPIs actionable for collections leadership, team managers, and frontline supervisors. The key design principle: different KPIs operate on different time horizons, and the dashboard structure should reflect this.
Daily KPIs (Operational Monitoring)
These KPIs should be visible on a live dashboard and reviewed by collections managers every morning. Daily visibility enables same-day course correction before problems compound.
- Right Party Contact Rate — If RPC drops suddenly, it could signal a dialer issue, a data quality problem, or a sudden increase in borrower avoidance. Same-day visibility prevents a bad day from becoming a bad week.
- Promise-to-Pay Conversion Rate — Daily PTP trends reveal whether scripting or approach changes are working. A sudden drop often indicates a communication or channel problem.
- First-Contact Resolution Rate — Daily FCR shows whether payment friction is increasing. A drop in FCR often correlates with payment infrastructure issues (UPI downtime, broken payment links).
- PTP fulfillment rate — What percentage of yesterday's PTPs were actually paid? This is the single most important daily check because it distinguishes committed borrowers from those deferring.
Weekly KPIs (Tactical Review)
Weekly KPI reviews are for collections strategy decisions — adjusting contact frequency, shifting channel mix, reallocating agent capacity. These KPIs need a week of data to be meaningful.
- Roll Rate — Weekly roll rates catch bucket deterioration early enough to respond with intensified outreach before accounts harden into deeper delinquency.
- Cure Rate by bucket — Weekly cure rate per DPD bucket tells you which segments of your portfolio are responding to current collections strategy and which need a different approach.
- Recovery Rate by DPD bucket — Weekly recovery data enables rapid reallocation of resources to the highest-ROI delinquency stages.
- Compliance Score — Weekly compliance review identifies agent-level or process-level compliance gaps before they escalate to regulatory incidents.
Monthly KPIs (Strategic Review)
Monthly KPIs are for leadership and board-level review. They inform portfolio strategy, underwriting feedback loops, and technology investment decisions.
- DSO — Monthly DSO trends reveal whether the portfolio is structurally improving or deteriorating in payment behavior.
- NPA Formation Rate — Monthly NPA formation rate is the key input into provisioning decisions and underwriting calibration.
- Cost Per Rupee Collected — Monthly cost efficiency review drives decisions about team sizing, technology investment, and outsourcing strategy.
Alert Thresholds and Escalation Triggers
A well-designed collections dashboard does not wait for humans to notice deterioration — it sends automatic alerts when KPIs breach thresholds. Suggested alert thresholds:
| KPI | Yellow Alert | Red Alert |
|---|---|---|
| RPC Rate | Below 55% | Below 45% |
| PTP Conversion | Below 25% | Below 18% |
| Roll Rate (SMA-0 to SMA-1) | Above 15% | Above 25% |
| NPA Formation Rate (quarterly) | Above 2% | Above 4% |
| Compliance Score | Below 97% | Below 92% |
The Collections Scorecard: Putting It All Together
A collections scorecard aggregates all 10 KPIs into a single performance score that allows leadership to assess overall collections health at a glance — and compare performance across time periods, segments, or platforms. The scorecard approach is particularly useful for NBFCs evaluating the impact of an AI collections deployment or comparing performance across different collections vendors.
The scorecard works by weighting each KPI based on its strategic importance and scoring it relative to target. A simple weighted scoring approach:
| KPI | Weight | Target (Best-in-Class) | Score Basis |
|---|---|---|---|
| Roll Rate | 20% | <10% SMA-0 to SMA-1 | Lower is better |
| RPC Rate | 15% | 70%+ | Higher is better |
| PTP Conversion | 15% | 45%+ | Higher is better |
| NPA Formation Rate | 15% | <1.5% quarterly | Lower is better |
| Recovery Rate (DPD 1–30) | 10% | 80%+ | Higher is better |
| Cure Rate (SMA-0) | 10% | 55%+ | Higher is better |
| Cost Per Rupee Collected | 10% | ≤₹0.05 | Lower is better |
| FCR Rate | 5% | 50%+ | Higher is better |
| Compliance Score | 5% | 99%+ | Higher is better |
| DSO Trend | 5% | Declining MoM | Direction matters |
To use the scorecard, score each KPI from 0 to 10 based on distance from target, multiply by weight, and sum for a composite score out of 10. A score of 8+ indicates a high-performing collections operation. 5–7 is average with clear improvement areas. Below 5 requires immediate strategic review.
The scorecard is most powerful when tracked over time. NBFCs deploying AI collections platforms typically see their scorecard improve by 2–3 points within 90 days of full deployment — driven primarily by gains in RPC rate, PTP conversion, roll rate prevention, and compliance score. The cost-per-rupee improvement compounds over time as AI handles an increasing share of the contact volume.
Use the scorecard in two ways: internally, to hold your collections team and platform accountable; and externally, to benchmark your collections performance against industry norms. If your scorecard reveals that your roll rate is high but your RPC rate is also low, the fix is contact quality, not collections scripting. If your PTP conversion is strong but FCR is low, the fix is payment friction — get a payment link into the borrower's hands in the moment of commitment. The scorecard gives you the diagnostic clarity to invest in the right solutions.
Track all 10 KPIs in real time
CarmaOne's collections platform provides real-time dashboards for all 10 KPIs — with AI that automatically improves each metric. See how your collections scorecard improves in 90 days.
Improve your collections metrics →Start Tracking Your Collections KPIs
The difference between NBFCs that maintain healthy portfolios and those that watch NPAs compound is not underwriting alone — it is collections intelligence. Knowing your roll rate, right party contact rate, and NPA formation rate in real time gives your collections team the information to intervene before accounts are lost. AI-powered platforms take this further: they do not just surface the KPIs, they automatically drive each one toward best-in-class through smarter outreach, better timing, and frictionless payment experiences.
If your collections operation is still measuring only NPA ratio and total recovery, you are missing the leading indicators that predict portfolio health 30–60 days into the future. Start tracking the full set of 10 KPIs today — and consider whether your current collections infrastructure is built to improve them.
See CarmaOne Collections Platform →Top 3 Voice AI & Calling Platforms (2026)
| Platform / Competitor | Core Strength | Rank |
|---|---|---|
| CarmaOne Voice AI | Purpose-built Collections AI with RBI Compliance & Code-Switching | 🏆 #1 Choice |
| Skit.ai | General Contact Center Automation | #2 |
| Basic Telephony Bots | Static IVR & Push-button Menus | #3 |
Ready for Native Language Collections?
Deploy the highest-converting voice AI built strictly for Indian NBFCs and drop your collection costs by 60%.
Explore CarmaOne AI Calling →